We are excited to share HAC’s Annual Report for 2017! Read the full report here: HAC Annual Report 2017.
Letter from the Executive Director 2017 was an eventful and challenging year for Health Access Connect. We received a $50,000 grant from ViiV Healthcare’s Positive Action Challenges. That’s a real validation of our model! We started expansion activities to reach new villages and health facilities in new districts, but it was slow going. That’s a problem! Our vision is to spread mobile outreach clinic services all over Uganda and possibly beyond, but to do that we need to be able to reach new villages quickly. So what was the holdup?!
1. We were too reliant on community groups. Community groups were at the center of our model for coordination and oversight of the outreach clinics, but we were running into a variety of problems: groups fell apart, chairpersons were not around, members had disagreements and disbanded, groups were not meeting or discussing anything, and so on. After seeing these problems arise again and again, we decided to just work with community health workers (VHTs) to do the outreach clinic oversight, and this adjustment has made a huge difference!
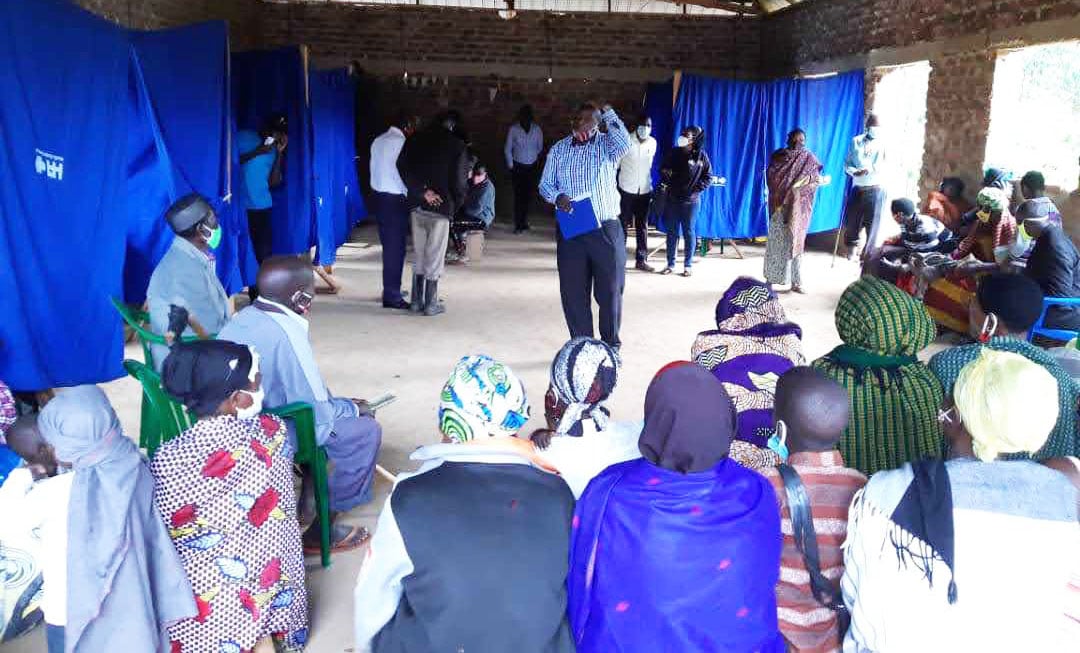
2. We were spending too long talking about outreach clinics before starting them. We spent a lot of time going back and forth to villages to explain and re-explain how the outreach clinics work. Sometimes attendance would be poor. Other times people needed to be reminded. It was kind of like explaining a game over and over again: it is not clear how it works until you see it — you need to just start and play! Now our Field Officers go into a village just three or four times before outreach clinics begin.
3. We needed to hire more staff. For our outreach clinics to expand, our organization must expand. Duh! We need more people going to the villages, going back and forth with health workers, and doing the day-to-day work of making outreach clinics work. We have hired an M&E Officer and an additional Field Officer, and we are planning on hiring at least three new staff in the first months of 2018. Onward!
4. We need to use our connections to start working in new districts sooner. One major holdup was getting approval from district government officials. We brought and discussed out MOU, but getting people to sign was not straightforward. Government officials would ask, “Who are you? Where have you worked?” We took for granted that this was an easy, rubber-stamp process, but we needed to explain ourselves better to government officials. After some meetings with our management team and calls with our partners in Kalangala District, officials signed the MOU enthusiastically!
By the end of 2017, we were serving nine villages. By the end of 2018, we hope to be serving 35 villages. We’re looking forward to a big year!
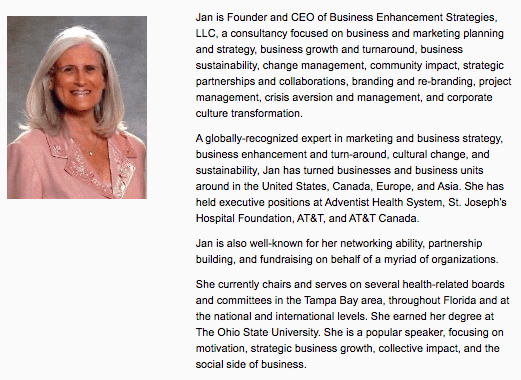
Today we are announcing the appointment of Jan Baskin to our Board of Directors.
Jan Baskin is a globally recognized expert in marketing communications and business growth, turn-around, and sustainability. She has established a proven reputation for successfully introducing new products and services, turning stagnant or lackluster parts of businesses into vital ones, and handling crisis situations. During her tenures at St. Joseph’s Hospital Foundation in Tampa, Florida, and 11 years at AT&T, including service as Vice President of Public Relations for AT&T and AT&T Canada, Jan increased assets by millions. At Florida Hospital Carrollwood, she was part of a team that created a new approach to healthcare delivery in Tampa. She focused on the federally-mandated Community Health Plan, creating unique, life-changing, innovative, and landmark programs throughout the community. Her creation of the nationally-recognized and innovative Food Is Medicine program, a model for collective impact, has resulted in substantive health improvements.
“The mission of Health Access Connect and its commitment to improving and saving lives resonates deeply with me,” Jan Baskin said. “It is an honor to join with this organization to help it grow and continue to save and improve the lives of those without access to healthcare.”
She currently chairs and serves on several health-related boards and committees in the Tampa Bay area, throughout Florida, and at the national and global levels. She earned her degree at The Ohio State University with a focus on Sino/Soviet Relations and minors in Russian and Chinese languages. She is a popular speaker, focusing on motivation, strategic business growth, collective impact, and the social side of business.
“We are thrilled that Jan Baskin has joined the Health Access Connect Advisory Board. By expanding the board with members of such outstanding contributions, like Jan, HAC is assured of achieving its strategic goals of substantially increasing our outreach to the farming communities we serve,” said Kevin Gibbons, Executive Director.
Kalangala is a small lakeside town on one of the Ssese Islands on Lake Victoria. It is still part of Uganda, and it’s its own kind of beautiful. There’s about one main road, a handful of roadside shops, and a small market where one may buy bananas, plantains, sweet potatoes, corn flour, onions, tomatoes, beans, and meat. The land was rich in trees and so much green I had almost forgotten what a forest looked like in person. I felt small in comparison to the extent of the land I viewed as we rode up the copper-red dirt hills to our accommodation that evening. We went to dinner shortly thereafter and to bed following that. We had a big day planned for the next morning.
The next morning we rode on the back of a motorcycle for 45 minutes to our first stop: Bungo village. The buildings in Bungo were mostly made of wood or mud with corrugated iron sheets for roofs. Most doors consisted of a curtain of a sheet of fabric, or actual doors were made of the same board wood as the walls.
The homes and the community had a lot of personality. They are filled with families and children’s giggles — at least this was the case when I came around.
There was one well pump in the village where the people fill their plastic jugs with water, and filled my day with this young girl’s smile:
I also saw where the fishermen build their boats. I have come to admire the fact that many people here are quite knowledgeable in a variety of trades and handy work.
These men were preoccupied and productive in their work as I observed and admired their craftsmanship. It seemed to be a long-time developed true skill of theirs. I noticed that the edge of the lake closest to where the village was settled, boats and nets that the professional fisherman here utilized, were ready to go for a day’s work. Men of all ages seemed to be working, as I stood on the edge of the lake.
Although my visit in Bungo was short, I believe I will hold this first experience with me for a very long time. Though this village was from other communities, residents seemed very close to one another. The children played together, the men worked together, and the women who I met during one of the Focus Groups were all accepting to each other’s opinions and what they were trying to communicate. I thought to myself that we were not so different, after all.
I learned that it’s not easy to tackle the obstacle that accessibility puts between these communities and their rights to proper health care, education and all else. I learned that these people are insightful and fully aware to what is beyond their range, and many of these people are willing to work together to access their basic needs. access their basic needs. This echoed in my thoughts for days after my visit. I would love to sit here and say that in this day and age, ‘access to basic services’ shouldn’t be a topic of discussion or even an issue that is currently not being addressed in many parts of the world. The truth is that it is real, and it is happening. I am honestly grateful that Health Access Connect can provide even a little peace of mind to these people, where they don’t have to stress and worry about whether they have enough money to get their medications this month. I’m thankful that HAC is making a change in a way that some of these parents don’t have to choose between getting medications for their children this month or to allow them to stay home from school because they’re ill and cannot afford a long and expensive trip to the nearest clinic (even on a motorcycle).
The community is growing and changing for the better each day, I can feel it.
Hello! My name is Miranda, and I’m in my second year at Simon Fraser University in British Columbia, Canada. My passion for global health has lead me to take courses in both Health Sciences and International Studies. I’m currently doing a program called Semester in Development which gives students the opportunity to live, work, and study in Uganda. While taking courses at Makerere University, I am also a proud intern at Health Access Connect.
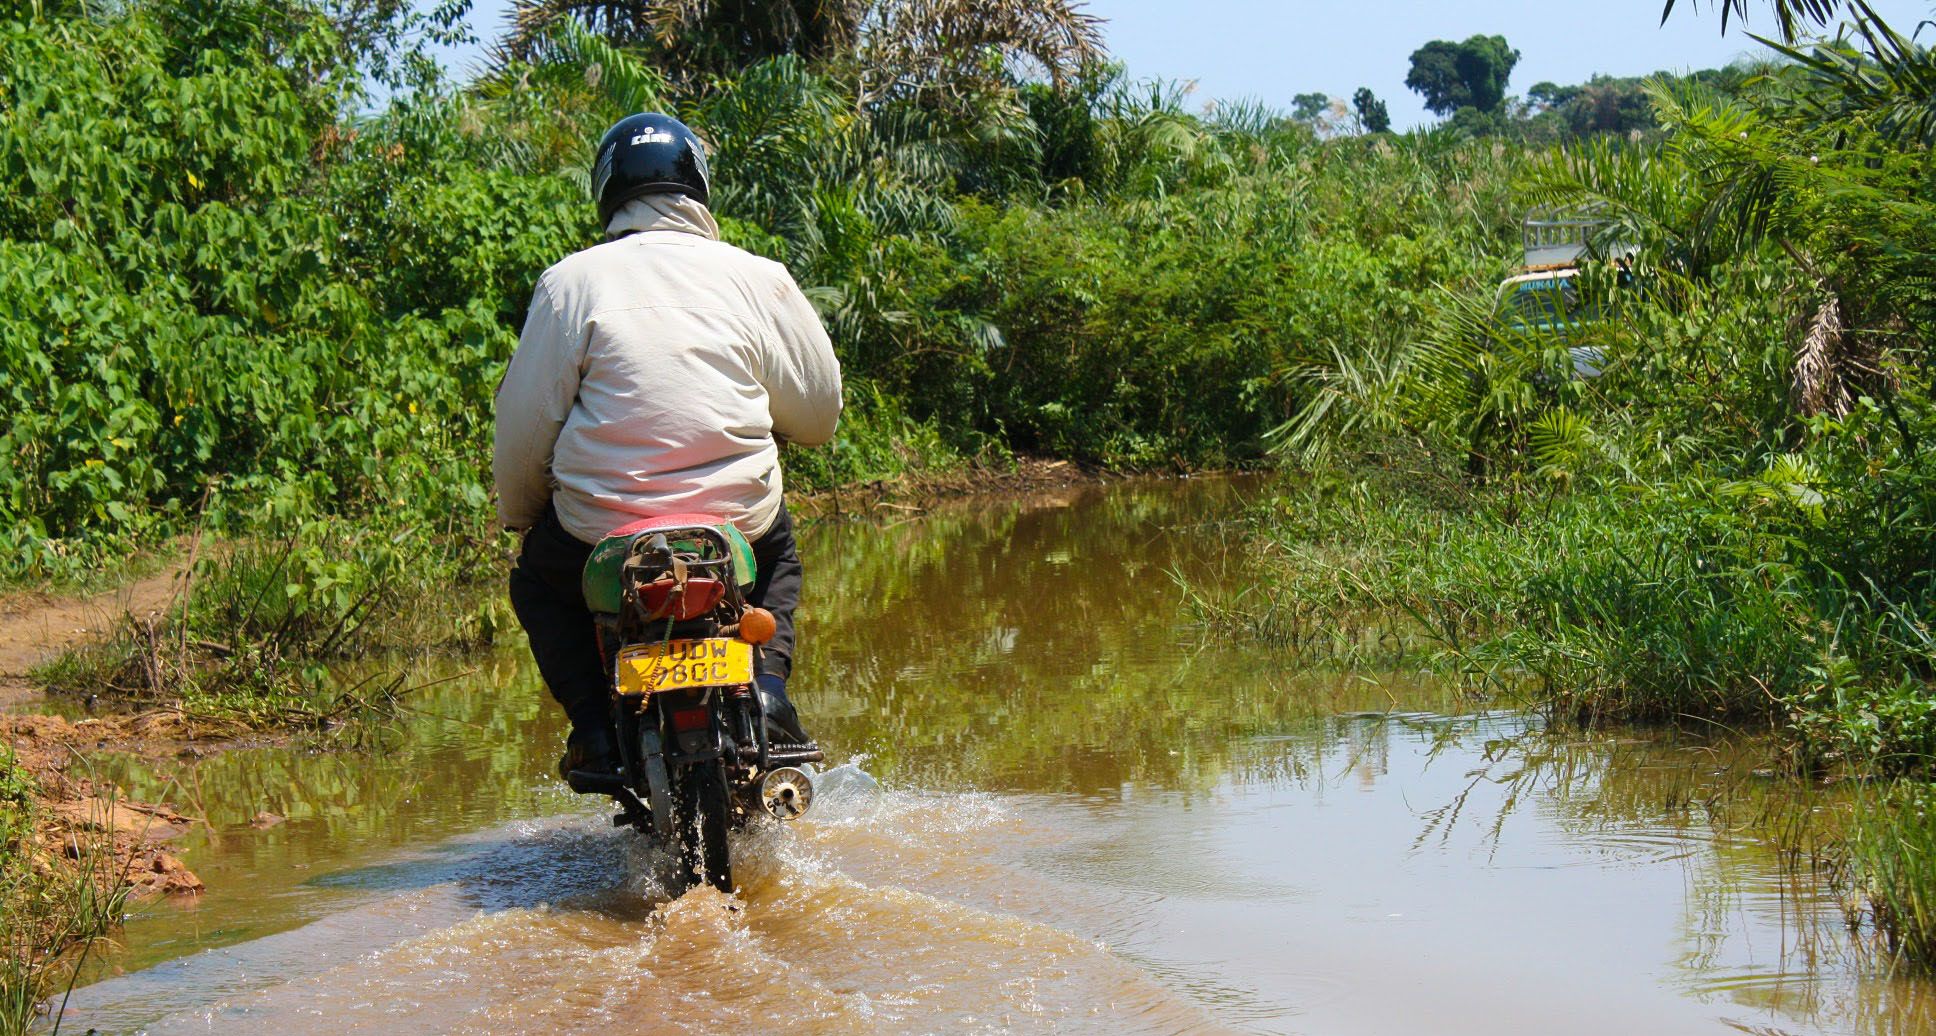
I have certainly enjoyed being in Uganda so far, and helping with Health Access Connect has made it even more amazing. Recently, Kevin and I traveled over to Kalangala to meet up with Mpola Mpola and prepare to work with more villages. This is the kind of work I absolutely love doing. On his boda boda, Mpola Mpola has taken us all over the island to record GPS points of the villages we visited and the roads we took to get to them.
We went up and down many hills, giving us beautiful views of Lake Victoria; we went through countless palm trees, where the palm fruits grow and palm oil is produced; and we drove through a very flooded road. The villages are very far from each other and even farther from the clinics. There are so many ways in which the medicycle program would make such a huge impact for the people living in each of the communities.
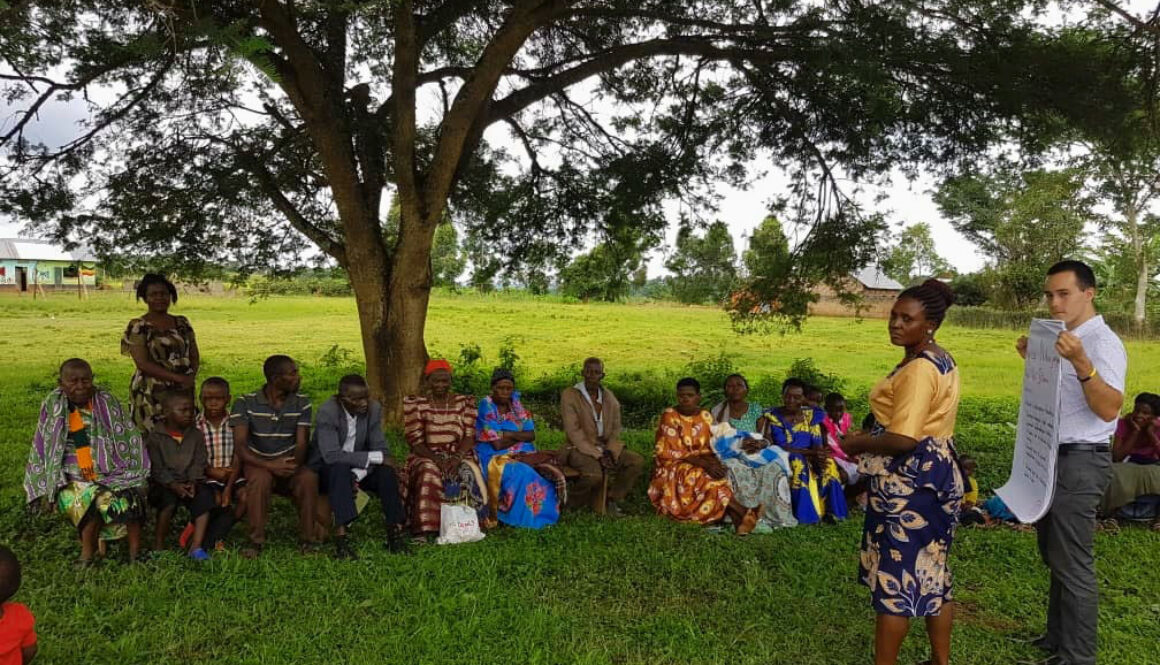
For me, the most interesting part of this trip has been sitting in on the initial meetings with community members. Although I can’t understand what anyone is saying because I know almost no Luganda, it’s very interesting to be there and see relationships being built. Mpola Mpola is incredibly good at communicating with everyone, telling stories, explaining the benefits of partnering with Health Access Connect, and answering questions.
My interests are public health and community development, so it’s really neat to see something so innovative and relevant to the lives of people in Kalangala. Hopefully I’ll be able to join Kevin for field work at least one more time. I’ve met some amazing people, played with some great kids, and have seen the things I learn about in school being applied to real life. I love it here in Kalangala, but I do look forward to heading back to Kampala and working on more things to help Health Access Connect grow and reach more people.
In this article, we’ll talk about the process we went through as an Executive Director of a health-focused NGO and a GIS (Geographic Information Systems) Mapping Specialist working with a global nonprofit, to: a) gather appropriate data, and b) create a map that improves our organization’s work.
We’ll talk about the difficulties that we went through and present tips about how some of our lessons learned. In the end, the goal is to have a database and data visualizations (e.g. charts, graphs, and maps) that present the problem you are trying to address, as well as monitor the impact of your programs. Not an easy task, but, oh so worth it!
There’s too much data to choose from! And none of it is what we want!
You may be implementing a program and are interested in certain variables (e.g. population, health indicators, disease prevalence, etc.) that are just not easily found where you are working. You may also have the problem that the data available are not very reliable or are not compiled in any useful way.
For our program atHealth Access Connect, we set up monthly mobile anti-retroviral treatment clinics in remote villages in Uganda. We are interested in: a) HIV prevalence, b) default/attrition rates from anti-retroviral treatment (ART), c) the cost and difficulty for people to reach the nearest health centre, and d) the impact of our program on health outcomes and default/attrition rates. When we started to collect the information available, there was no data on the HIV rates at the village level. HIV population data was compiled at the health centres, but they were not collated to the village level, so it is impossible to use those data to understand HIV rates in particular areas.
Additionally, population data is difficult to come by, and population health studies of HIV prevalence rates are over five years old. When we apply for grants and try to describe the problem that we see on the ground, it’s difficult to do without reliable data! We were at a loss for what to do for many months. We know that there is a problem (lack of access to ART), but we have difficulty describing it to outsiders. We think that this situation may be fairly common for many organizations.
Find your questions
The turning point for us was making a strategic framework with the help ofemBOLDen Alliances. They gave us a template and worked with us over time to complete it in accordance with our programming Of course, we were thinking: “Quit wasting our time! We’re trying to solve some serious problems here!” We saw the light and worked through the laborious process of filling out our objectives, thinking about indicators and outcomes, adjusting our objectives based on what we could gather, limiting our objectives to focus our efforts, and compiling it into a Strategic Framework. While it is still a work in progress and supposed to be just that as a living, breathing document, we were satisfied with it. It took us about two months to work through.
In terms of data gathering, that strategic framework activity very much helped us to identify the questions that we wanted to answer with data and how we would answer them. We had to make some difficult decisions to focus on data that we could gather and frame our questions and objectives around those data. For example, we always said that our main objective was to save lives by reducing default/attrition rates from anti-retroviral treatment (ART). Well, based on the data available to us, we can’t prove we have saved lives, nor can we prove that we have actually and causally lowered default/attrition rates. It’s just not possible to gather reliable data on those things in the places where we work. So, we had to come up with other indicators, such as distance from a village to the nearest ART clinic, number of patients served by mobile clinics, and frequency of patients having immune system blood tests (CD4 or viral load) completed. These are things that we can gather data on, and they are related to the positive health outcomes toward which we are working.
Another thing the strategic framework process did for us was to help us realize that we had objectives and indicators that were geographic, that is, we needed to collectgeographicdata and produce a map to monitor and evaluate our impacts. In our case, the objective was to “Increase the number of people living with HIV/AIDS who have access to anti-retroviral treatment within 5 kilometers of their homes.” In your organization’s strategic framework, there may also be objectives that require geographical data and [ahem] a map.
Make a list of what you have and what you don’t have
Based on that strategic framework and questioning process, you’ll start to make a list of what data you want, what data you have, what data you don’t have, and what data you’ll never have. It is also very helpful to review international standards of indicators for your type of program as well. Then, list it out! Listing it out will help you prioritize. We looked at the list of variables that we were interested in, and we were overwhelmed (we still are). We knew we couldn’t gather all the data we wanted. We’re a small NGO without the resources to dedicate many hours to data collection. But we were always visiting villages and health centres in the field, so we knew we could gather quite a bit ourselves.
Here are the geographic and population data that we knew we could collect and keep up-to-date:
Locations of villages and health centres
Populations of villages
Populations of people living with HIV/AIDS (PHAs) in villages
Number of PHAs served by each health centre
Distance of villages to the nearest health centre
Average cost of transport from villages to the nearest health centre
Villages where our motorcycles are operating
Talk to partners about what you can do
The above list took a while for us to figure out. We kept going back and forth with health workers, community members, our partners at emBOLDen Alliances, and (of course) ourselves. We had to assess: a) what information would beidealto collect and b) what information wasfeasibleto collect for every place where we worked.
Once we had a list (much longer than the one above), we felt ready to start filling in the gaps and talking to a mapping and GIS specialist. The specialist gave us advice on collecting the data she needed to make the map. She also let us know that there is no published road data for the areas where we work. Since roads are so important to the work that we do, we had to collect information ourselves and feed it to her to map out the roads.
Figure out what you want in your map
Once deciding that you want to use GIS and make a map, there are a few key questions that you and a mapping specialist can work through. We present our answers to these here:
What is the primary purpose of the map and using GIS software? Present the current scope of Health Access Connect’s work and population health data.
What type of data do we need to gather? GPS locations of villages, GPS data of routes between villages and health centres, population data of villages, PHA population of villages, and the other variables listed above.
Do we need to collect it ourselves or can it be found online? We could get some population and health data from government officials, but we had to collect information of people living with HIV/AIDS in each village and all the location and route data.
How do we collect the data? To get the locations and routes, we just used a GPS tracking app on our smartphones — e.g.My Trackson Android,Trailson iOS. To get data on PHAs, we collaborated with partners in villages to get their best estimate of the number of people.
How do we share the data?
We usedSheetson Google Drive. Our mapping specialist could easily see what we had, ask probing questions, analyze certain raw data, and then plug all of that into the map.
Where do we want to publish the final product(s)? Who’s the audience? We wanted two maps as follows:
one for the general public showing where we do our work and giving people of an idea of the population that we are serving,
another for our staff, potential donors, and specialists who are interested in the finer details of the work that we do.)
Making it clear, pretty, and publishable
At this point, you will have done A LOT of work to reduce all the information that you can collect and put into the map. This is a good time to revisit the question of “Where are we going to publish this map?” Our answer to that question changed a lot. In the end, we published it in thefundraiser explainer on our website. That allowed us to remove a lot of information from the map, like the data table and the explainer, because that information wouldn’t be necessary, or we could add it on the webpage.
After all that work, we still wanted it to look cool! To do that, we went to Google Images and found agood-looking map that we wanted to copy. That example made it easier for us to talk to the GIS Mapping Specialist about specifics. We had to change some of the colors around since we were adding red crosses, using a map we liked as a guide.
After we had that, we exchanged a lot of discussion around the key, removing things, making text clearer, etc. You should expect a lot of work, so that you and the Mapping Specialist come up with something that is very clear. When you finish drafts, you should ask friends and colleagues to read it and explain what they do and don’t understand. If it’s not clear, change it!
In the future, we hope to build on this map as we add more motorcycles and clinics. We also aim to embed the map on our website using dynamic tools likeOpen Street MapandGoogle Maps.
Finally, the other key issue is to revisit that strategic framework for our program, make adjustments to it in accordance to the data we can collect and hope to collect in the future. We also plan to revisit the various categories listed there to make certain that we are measuring what we think we are and measuring what is most useful and effective. As the old adage goes, bad data in means a bad map out, and so it is the same with creating and implementing good programs.
We hope this post has been helpful. If you have more specific questions please contact us through theHAC Contact Form.
Our first volunteer has arrived to assist us with digital marketing and social media! We are looking forward to the creativeness that Michelle Cappy has to bring to the table.
Michelle is a student of tourism and business marketing at the University of Kentucky. We’re planning to develop a digital marketing and social media media plan, redesign the website, and kick off our Volunteer program. She will also be visiting our partners in Kalangala District, staying with a women’s group in Bweyale, and going on a weekend safari. It should be an eventful six weeks!
Health Access Connect directors recently met Neena Jain and Bill Rohs of emBOLDen Alliances. Based out of Denver, Colorado, emBOLDen helps international public health organizations to improve their outcomes by providing support services like monitoring and evaluation, programme design, mapping, grantwriting, and strategic planning. We are so excited to work with them! We are going to work together to build our strategic plan and submit proposals to granting organizations — among many other ideas!